

.jpg)
Deirdre Hennigar
Subject matter expert


Subject matter expert
Alert fatigue is often framed as a capacity problem: too many findings, not enough analysts. We wanted to see how much of it is really a filtering problem.
We pulled eight months of scan output from four of our client environments that we monitor continuously. Across all four, our tooling produced 21,639 findings. We sent 182 of them to the clients.
This post covers what was in the gap, what made it through, and what the 182 had in common.
Across four client perimeters, January to September 2026:
The sample
What we sent
Four randomly selected client environments, monitored from January to September 2026. Everything below is scoped to each customer's own perimeter: the assets they gave us, the subdomains we discovered underneath those assets, and the address ranges they own. No third-party or CDN infrastructure is counted.
They range from a single-domain organization to one with over a thousand owned addresses. Across the four:
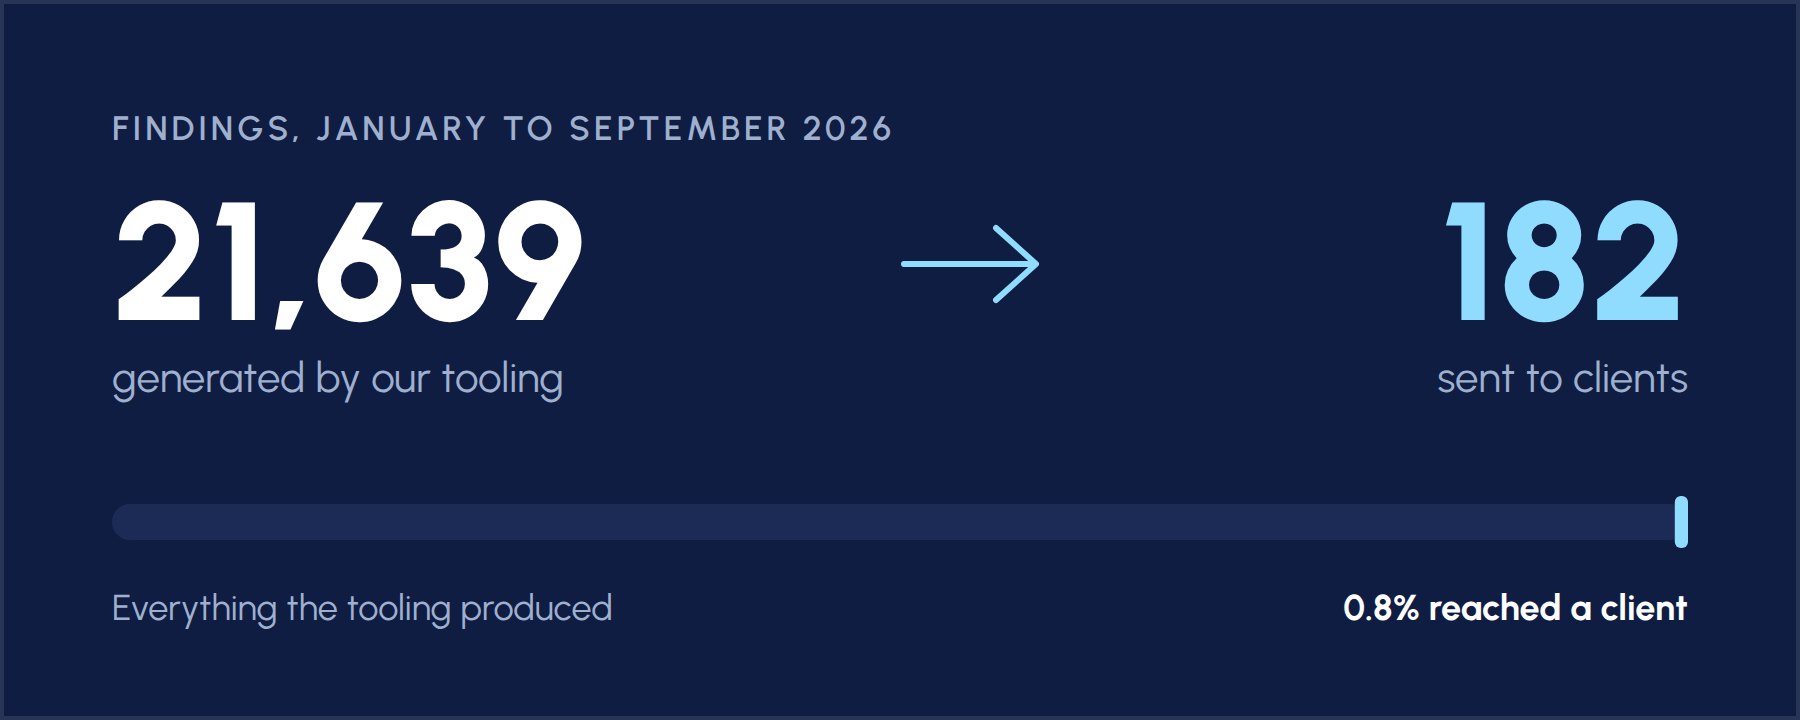
20,973 of the suppressed findings are informational: a port was observed open, a web server returned a header, a certificate was presented, an HTTP method was enumerated, etc. Each one is accurate, and none of them on its own describes a weakness.
Scanners and other reconnaissance tooling record this material because they can't know in advance which observation will matter later.
At two minutes per finding (long enough to read it, check the asset and dismiss it) 21,639 findings works out to roughly 721 hours. That is one person, full time, for about four and a half months, to end up with the same 182 items (customer-specificity aside). The figure is an illustration rather than something we measured, but it matches what we see: reports that size get set aside.
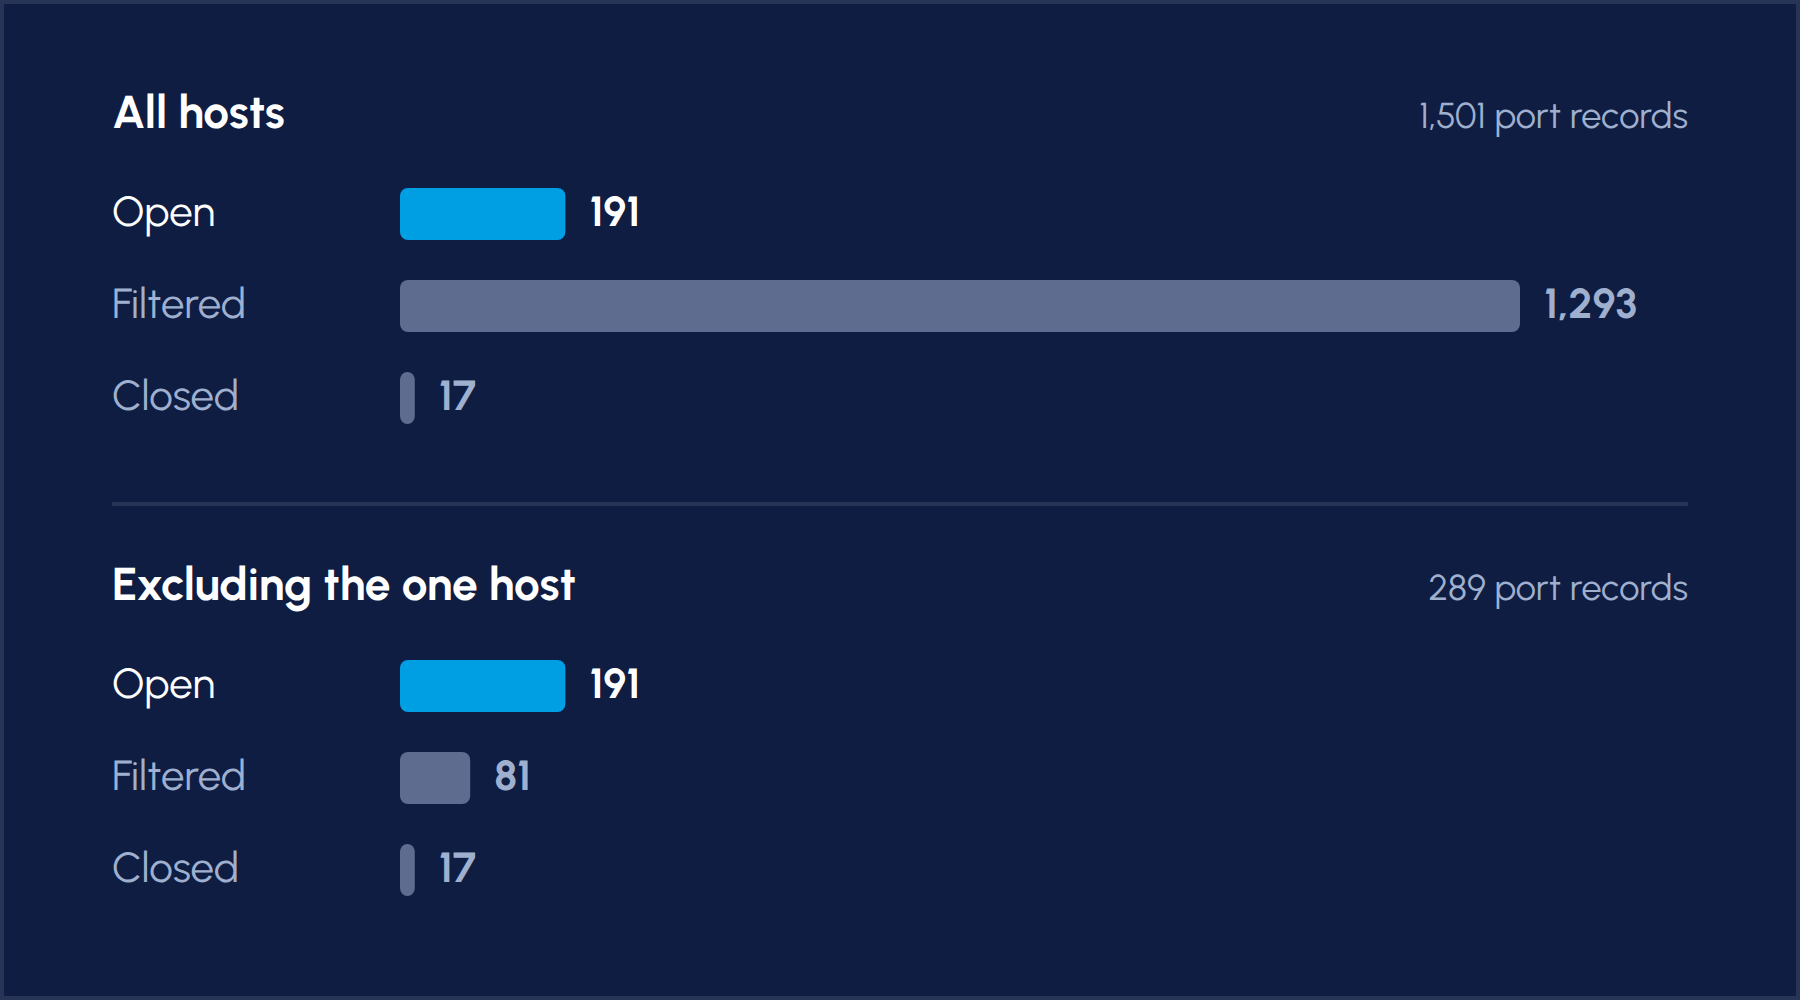
One host on a client perimeter reports 1,212 ports in a non-closed state, which is more than the other three clients' entire attack surfaces put together. Counted by volume, it looks like an emergency.
All 1,212 of those ports are filtered, not open. Filtered means the scanner sent a probe and got nothing back: no response, no refusal, no service. Something between the scanner and the host is dropping the traffic. The scanner can't tell a closed port from a blocked one, so it reports that it does not know.
182 findings reached the four clients: 15 critical, 19 high, 148 medium.
Around 150 of the 182, roughly four in five, are certificate and transport-encryption issues: certificates issued to the wrong hostname, certificates whose chain will not validate, certificates that expired, obsolete TLS versions still accepted, and weak ciphers still offered.
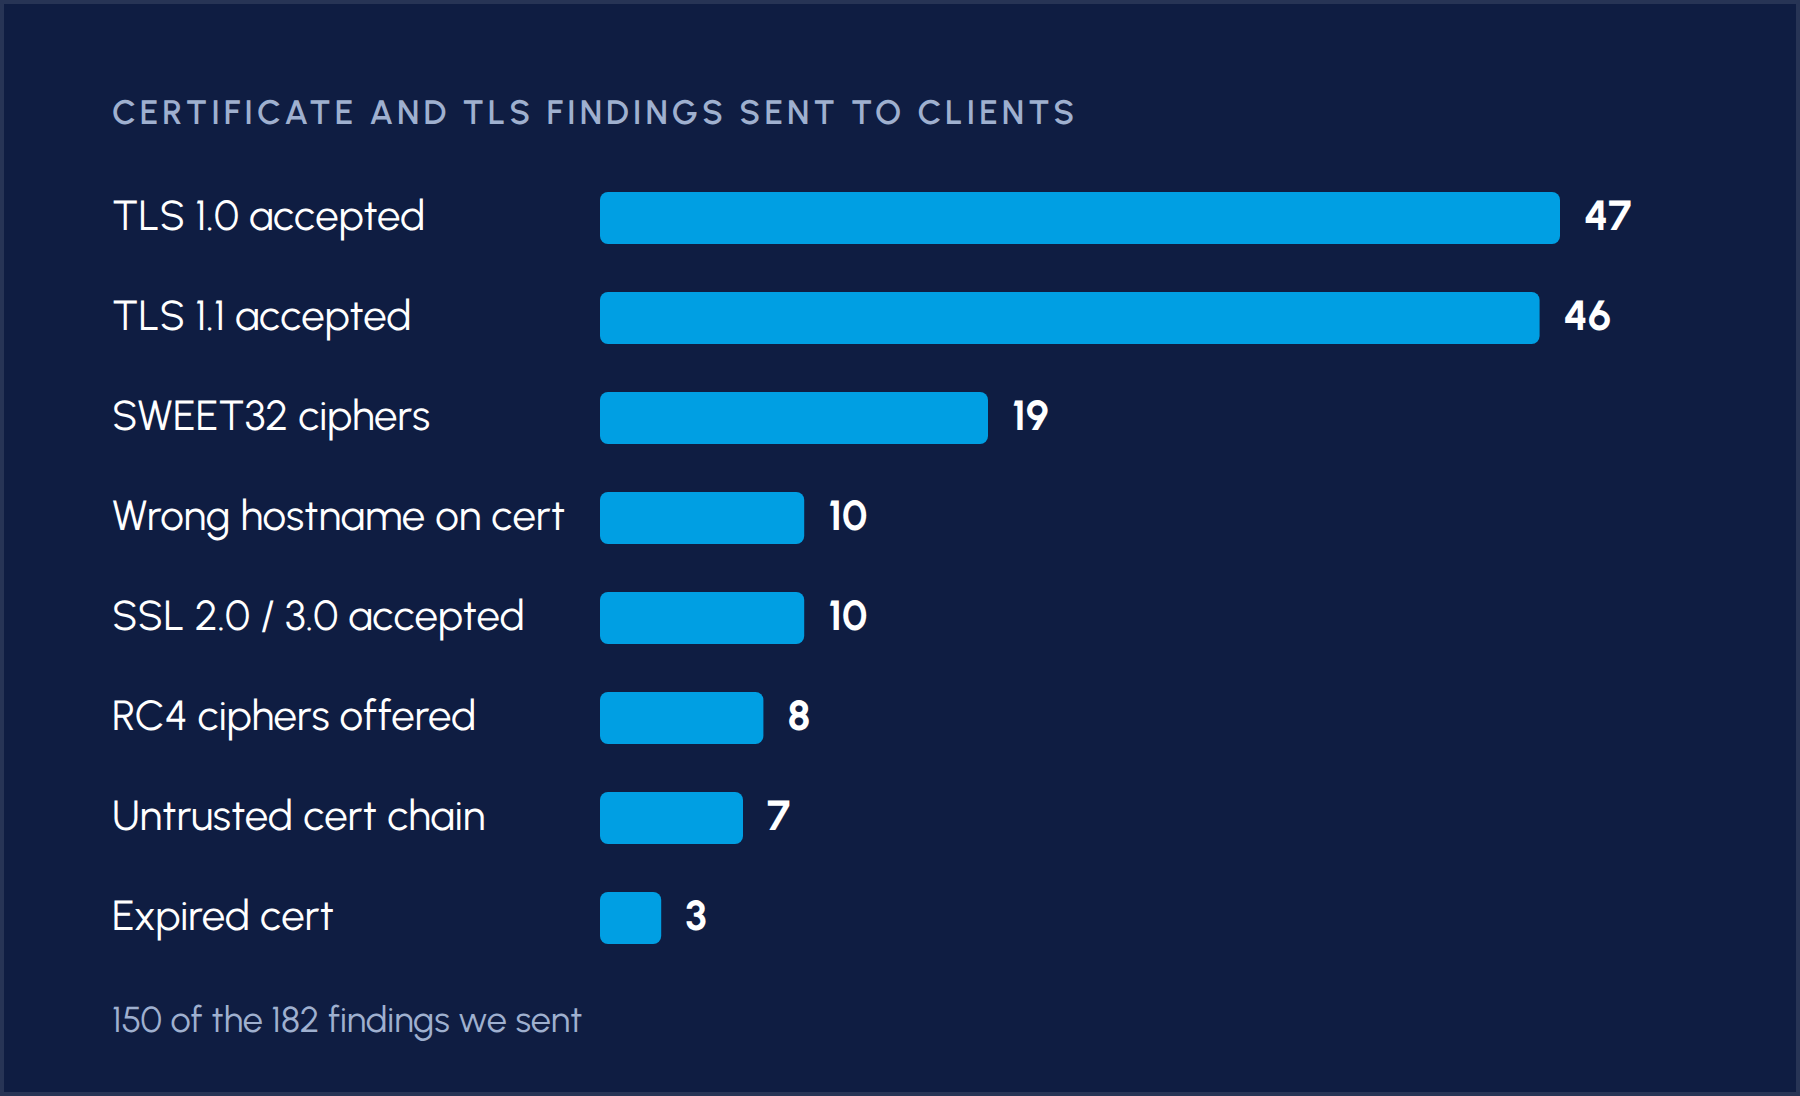
Ten (10) of the fifteen (15) critical findings are the same issue: a service still willing to negotiate SSL 2.0 or 3.0, both of which the IETF has formally prohibited. All nineteen high-severity findings are SWEET32, which affects 64-bit block ciphers such as Triple-DES. That is one weakness, nineteen times, across more than one organization.
None of these need an exploit to find. They show up in any TLS scan, and most of them are fixed with a configuration change or a certificate renewal.
Of the 191 confirmed open services, 152 have been present for the entire eight months analysis timeframe. Same address, same port, same service, seen in January and still answering in September.
Some of that is expected. A public web server is supposed to stay open. But it also means anything learned about these perimeters in January is likely still accurate.
These apply whether the reports come from a vendor or from tooling you run yourself.
If certificate and TLS hygiene really is four fifths of what is visible from outside, which is what this sample suggests, most organizations would get more out of a certificate inventory than a new tool: which certificates you hold, who renews them, and which of your services still accept protocols that were retired years ago.